3 Reasons Your Gantt Chart Needs a Glow-Up
Table of Contents
Imagine what your workplace would look like if it was filled with technology from the 1910s.
You could get to the office in your horse-drawn carriage, deliver a visual report with your kinetoscope, hear the news on your short-wave radio, and track project updates on your Gantt chart.
While these tools were revolutionary at the time, they’ve been largely deemed obsolete over the past 100+ years — and replaced with shiny, new, technologically advanced tools that streamline the modern work world.
Well, all of them except the Gantt chart, that is.
That’s right. Even though project management is much more complex today than it was in the early 1900s — with remote teams spread across the globe and endless customer touchpoints — many managers still use this outdated tool to organize their portfolios.
The question is: Why? We’ve traded in carriages for Teslas, kinetoscopes for HD screens, and radios for social and streaming apps. So, isn’t it time project managers traded in the ancient Gantt chart for a solution that actually suits the digital age?
Of course, it is.
Here, we’ll break down why the Gantt chart is a thing of the past and how you can upgrade your project management platform for the modern era.
They’re meant for managing simple projects
Gantt charts are meant to make project management simple. And simple is good if you’re working on a project with only a few participants and tasks. But once you start to scale your operations across teams and stakeholders, you quickly realize the limitations of Gantt charts.
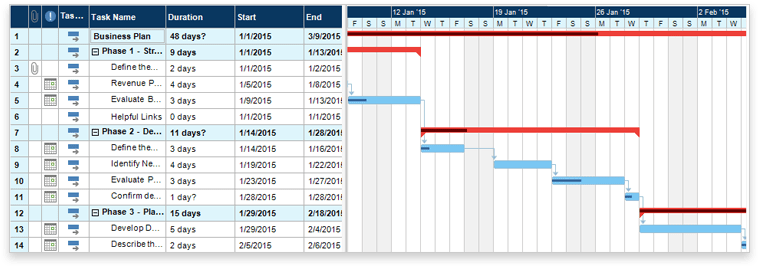
At their core, Gantt charts are just bar charts. On the left-hand side, you have a list of tasks and at the top you have a timeline. Each task is given a horizontal bar, indicating its start date, end date, and duration of time. This way, you can see how projects overlap and when they’re expected to be done. The bars also might be connected by lines and arrows, showing which tasks are dependent on each other.
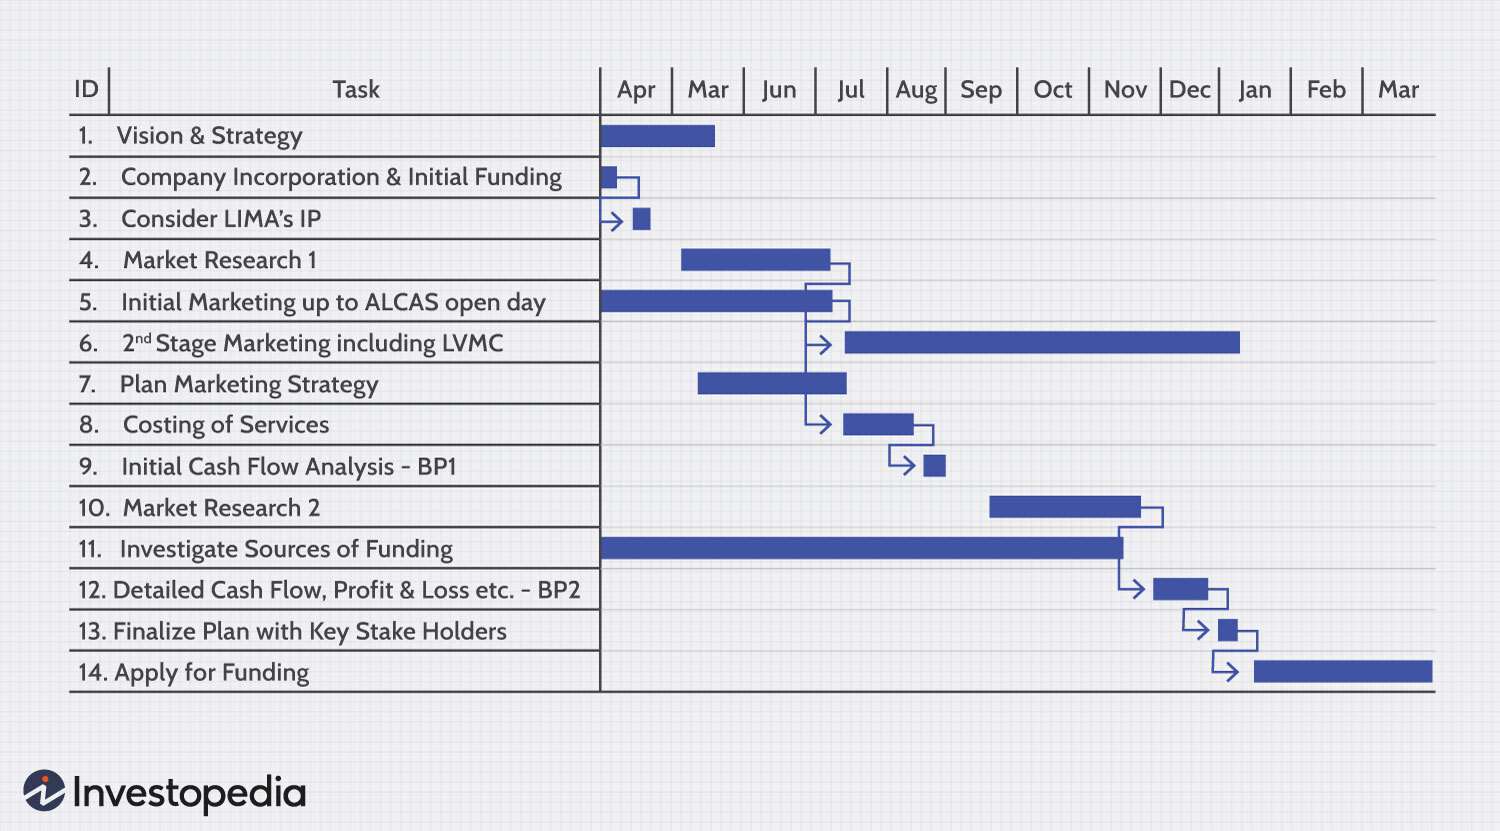
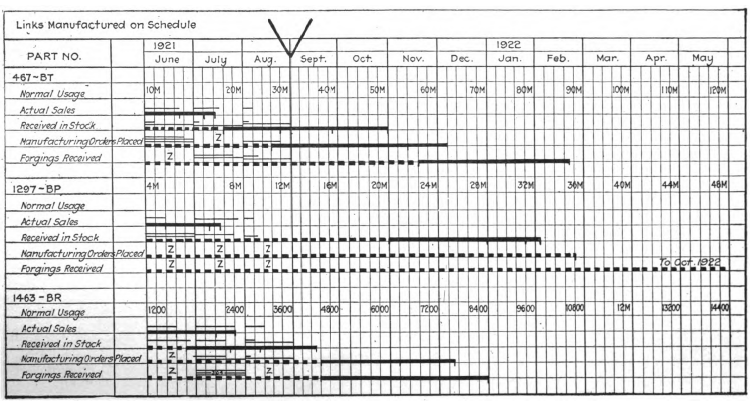
Simple, right? So simple, in fact, the design has barely changed since the early 1900s:
Now imagine adding even 10-20 more tasks — or even hundreds — and projects that span several months if not years. You’ll be left scrolling up, down, and across each time you need to find an item and decipher its place within your timeline.
Not to mention, time isn’t the only indicator of a project’s complexity. Sure, a project might be completed in a month, but it might also require significant resources and cross-departmental input. These factors, which are crucial to project management, just aren’t represented in a simple Gantt chart.
They don’t provide full-portfolio clarity
Gantt charts can help you oversee the tasks of a single project. But they don’t actually offer a bird’s-eye-view of your entire project portfolio. And, as many managers know, projects are often interlinked and dependent on each other. So making changes to one project can trigger a domino effect, forcing you to manually go in and make changes to the other projects.
That’s why, in place of the old-fashioned Gantt chart, Proggio uses an intuitive ProjectMap™ — letting you view and manage your entire portfolio on a single, adjustable timeline. With the ProjectMap™, each team has a dedicated workstream of projects, so you can hone in on specific tasks from a single screen instead of juggling multiple spreadsheets.
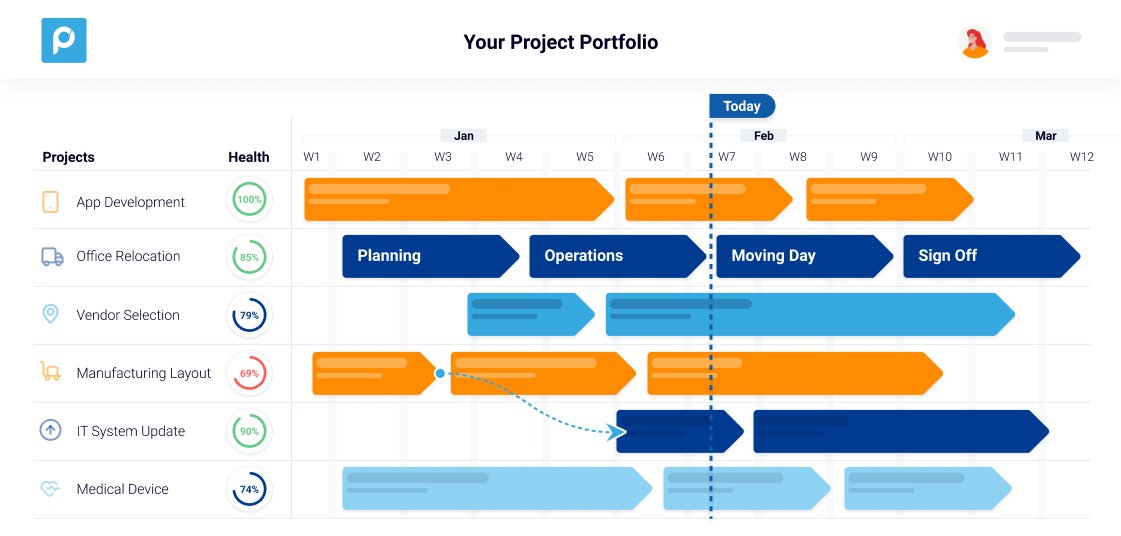
The ProjectMap™ also provides an auto-generated status or “health indicator” for each project, along with the option to prioritize and reprioritize projects according to your business goals. In fact, you can make changes on the fly with a drag-and-drop functionality, and Proggio will automatically make any subsequent changes accordingly.
They’re not built for collaboration
Even if you’re able to get the hang of a Gantt chart, you can’t easily share it with your boss to report progress across the organization. And you can’t ask team members to update it themselves, because it’ll mess up your whole timeline.
As a solution to this problem, Proggio offers custom Dynamic Views of your projects. With Dynamic Views, you can create, share, and oversee cross-functional projects and reports on one, collaborative timeline. You can also make this timeline public or private, and share it with the necessary stakeholders to provide updates as needed.
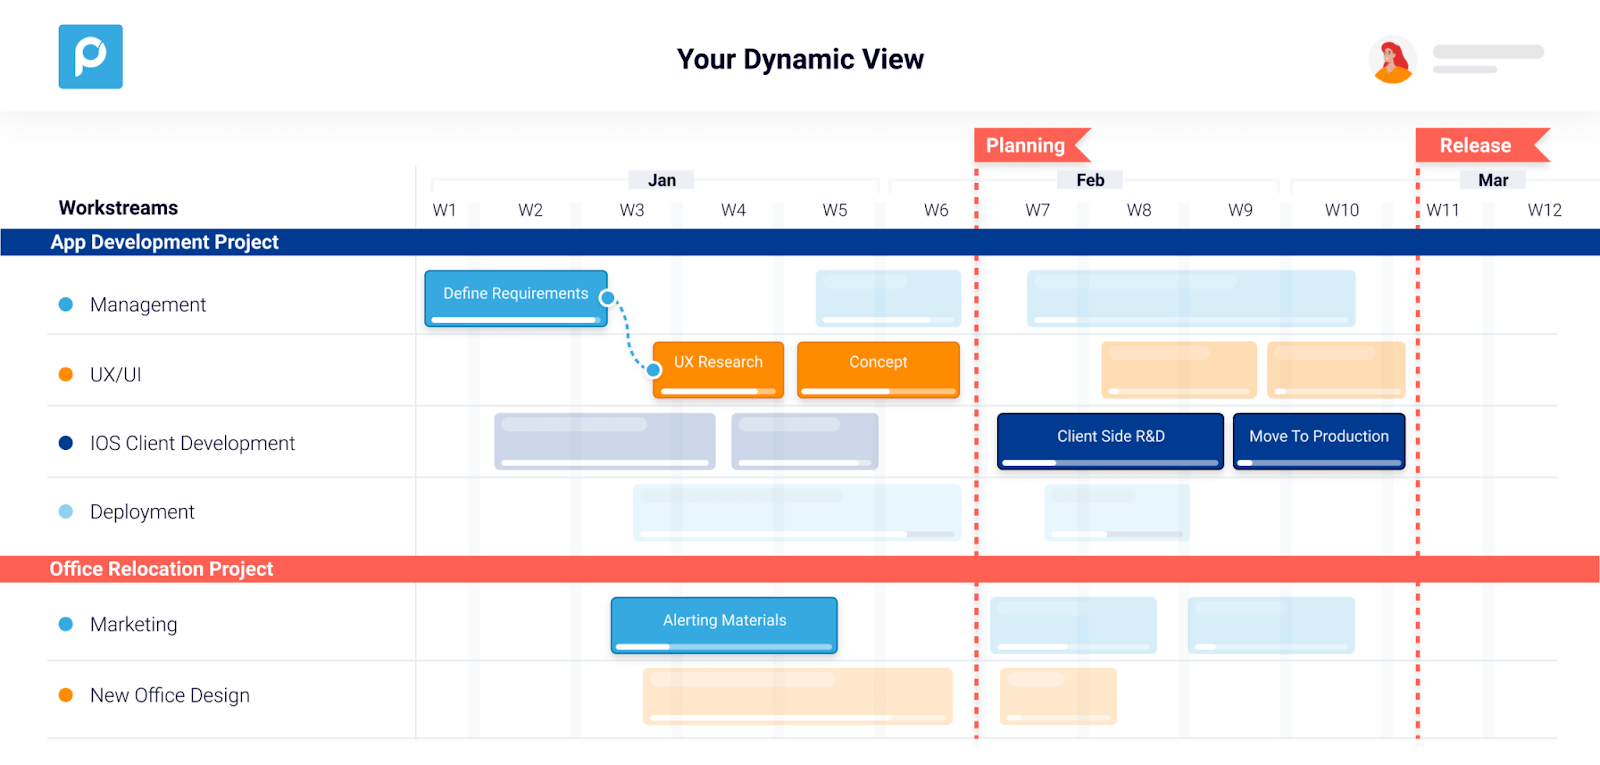
Ultimately, trying to collaborate on a Gantt chart would only cost you valuable time and resources. But Proggio’s adaptive platform gives you a real-time view of each project’s data, making it easy to share updates across the entire company and keep everyone on track towards their goals.
Give your Gantt chart a glow-up
Yes, project management owes a lot to the Gantt chart. It provided a foundation for streamlining processes that impacts the industry to this day. But if you’re still relying on this simple method to manage your entire portfolio, you’re likely wasting valuable time and resources — and missing opportunities to optimize workflows.
In other words, it’s time to enter the modern era of project management. And Proggio can help. Our adaptive project management platform gives you complete clarity across your entire portfolio, so you can easily collaborate across teams and adapt to changes in real time — without having to deal with tedious, manual updates or overly complex spreadsheets.
So, are you ready to bring your project management operation into the 21st century?
Book a demo to get started.