Budget reports are financial documents that provide a detailed overview of the financial status of a project, department, or organization. They track the allocation, expenditure, and variance of funds against the planned budget, helping to monitor whether the project is staying within its financial limits. These reports typically include information on projected costs, actual spending, remaining budget, and any variances or discrepancies between planned and actual expenditures. Budget reports are essential tools for financial planning, control, and decision-making, ensuring that resources are being used efficiently and effectively.
Setting up budget reports in project management is crucial for several reasons:
- Financial Control: Budget reports provide real-time insights into how funds are being allocated and spent. This helps project managers control costs and prevent overspending, ensuring the project remains within its financial limits.
- Tracking Progress: Regular budget reports allow for continuous monitoring of financial performance. They help identify any discrepancies between planned and actual spending, enabling corrective actions to be taken promptly.
- Resource Allocation: By understanding the financial status of a project, managers can make informed decisions about allocating resources efficiently. This ensures that funds are directed to the most critical areas of the project.
- Risk Management: Budget reports help in identifying potential financial risks early in the project. By monitoring expenditures closely, project managers can spot trends that may indicate future budget issues and take preventive measures.
- Stakeholder Communication: Budget reports provide transparent financial information to stakeholders, building trust and ensuring everyone is informed about the project’s financial health. This transparency is key to maintaining stakeholder confidence and support.
- Decision-Making: Accurate and up-to-date budget reports are essential for making informed decisions. They provide a clear picture of the financial landscape, helping managers adjust strategies and plans based on the current financial status.
Budget Report Setup:
In order to make use of the high level budget report, there are few steps that you need to take.
- Go to the Team Admin page and select Settings
- Enter the Monthly Average Labor cost (per month)
- Click Save
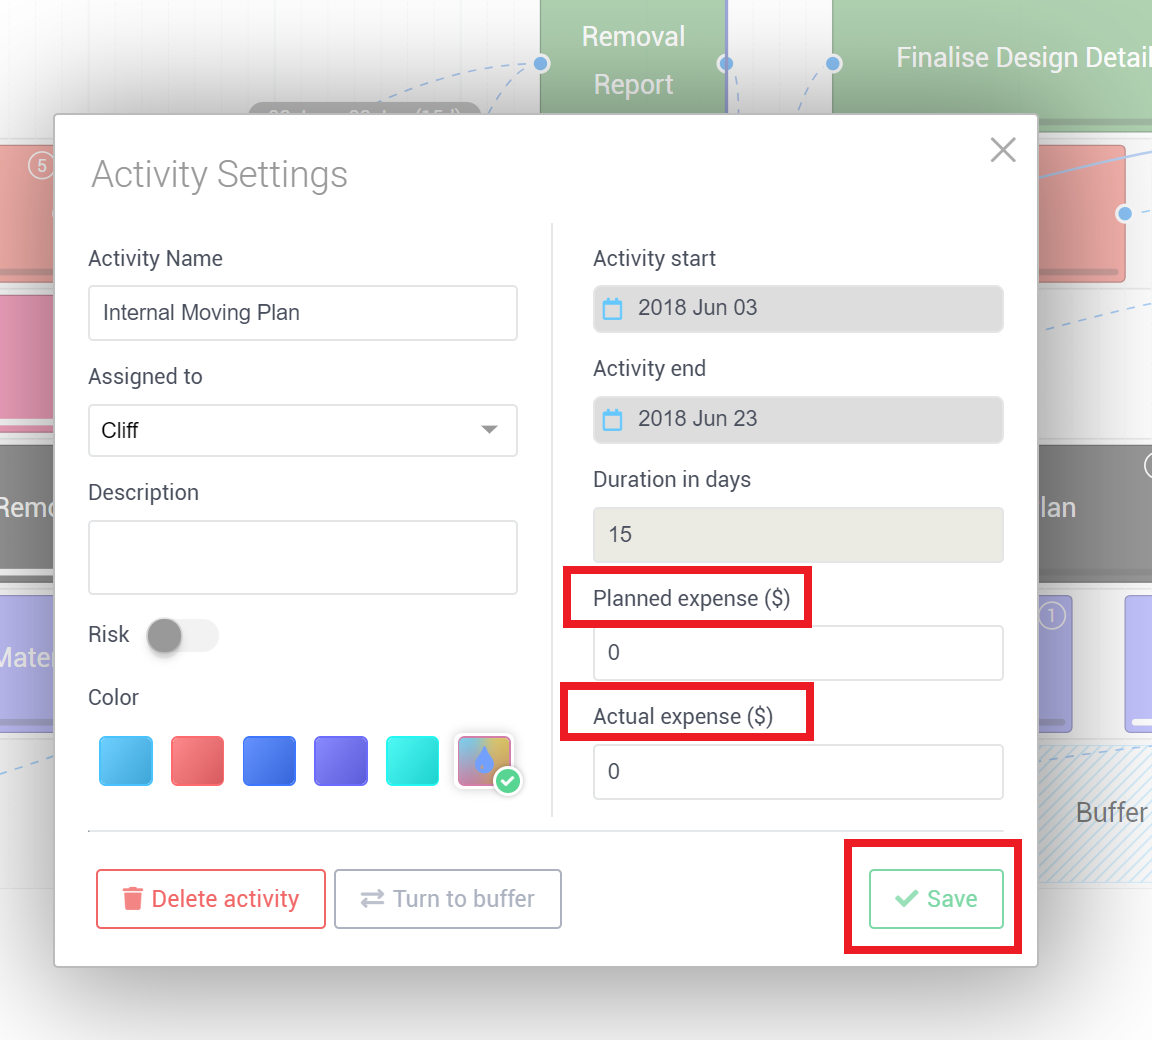
Each activity should have it’s own individual Planned expense and Actual Expense
- Select the activity
- Select the Activity Properties icon
- Enter the amount for Planned Expense and for the actual expense (of course this may very well change over time)
- Click Save
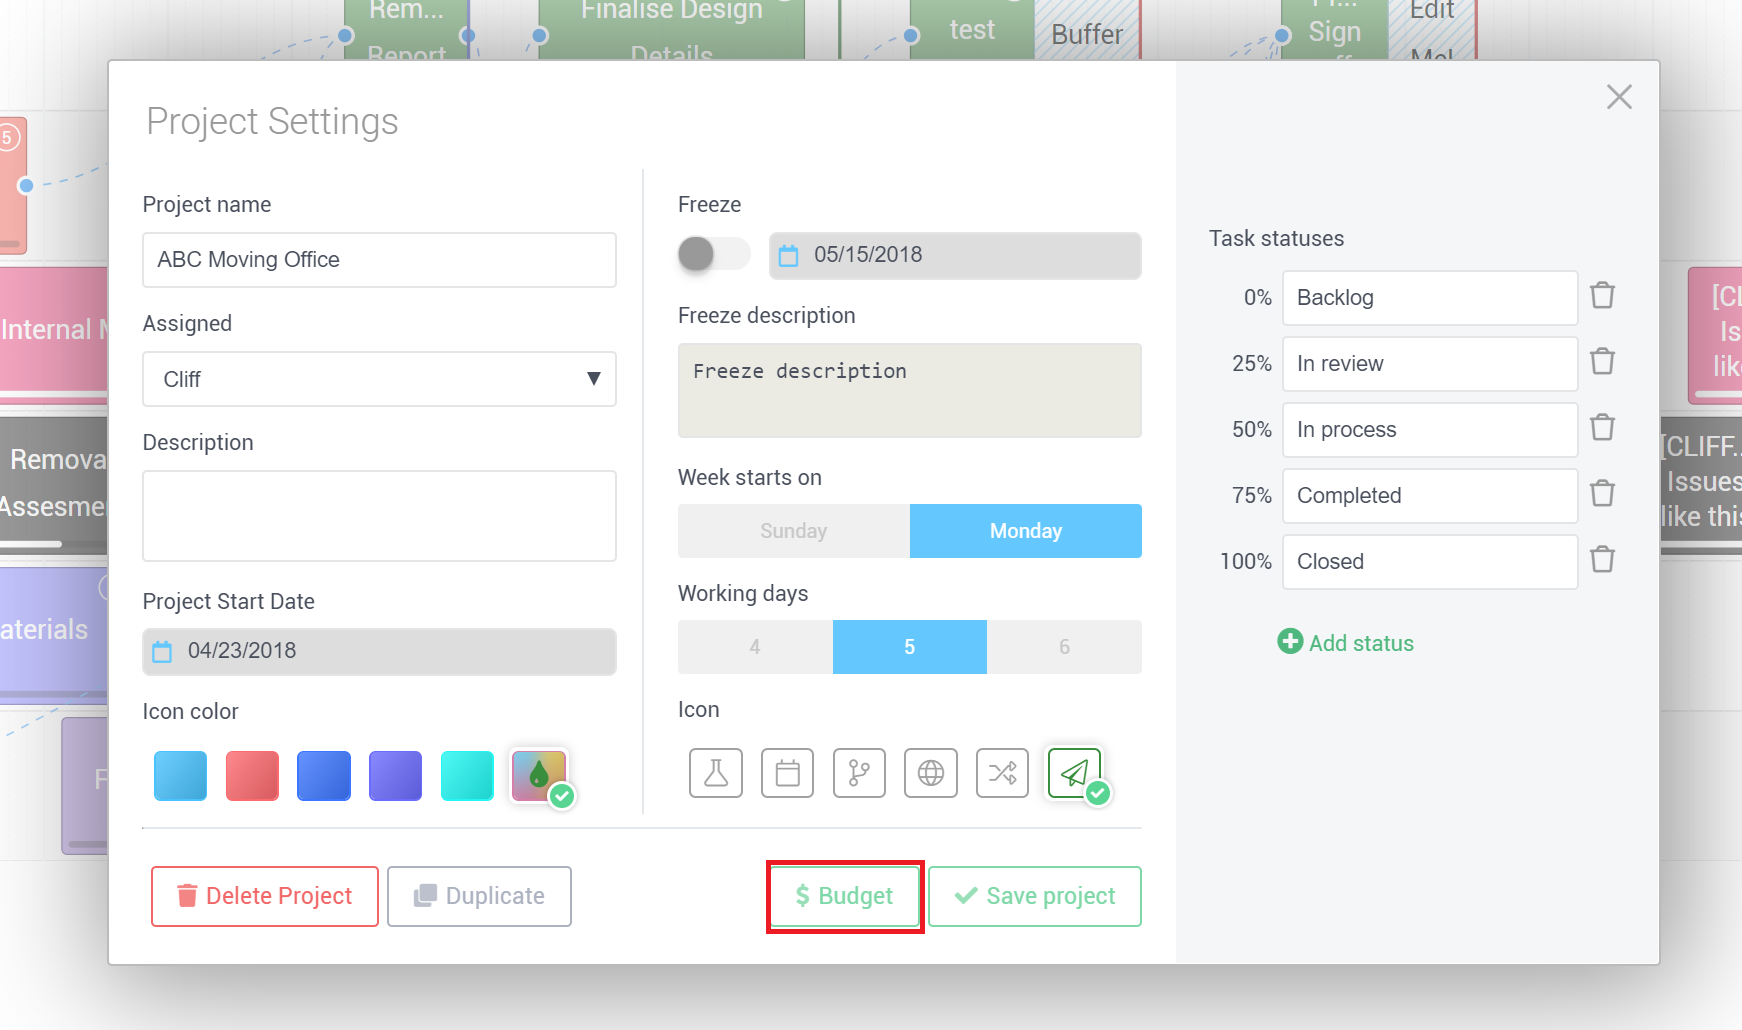
Generating the Budget Report:
Now that the details have been added to the project, you can generate the report.
- Go to the Project Settings
- Click on the Budget Button
The budget report will appear as a popup on your screen, You may also export a copy of the report to a CSV file, by clicking on the Export button at the bottom of the page.
Below the screenshot of the budget report is an explanation of the details within the report.
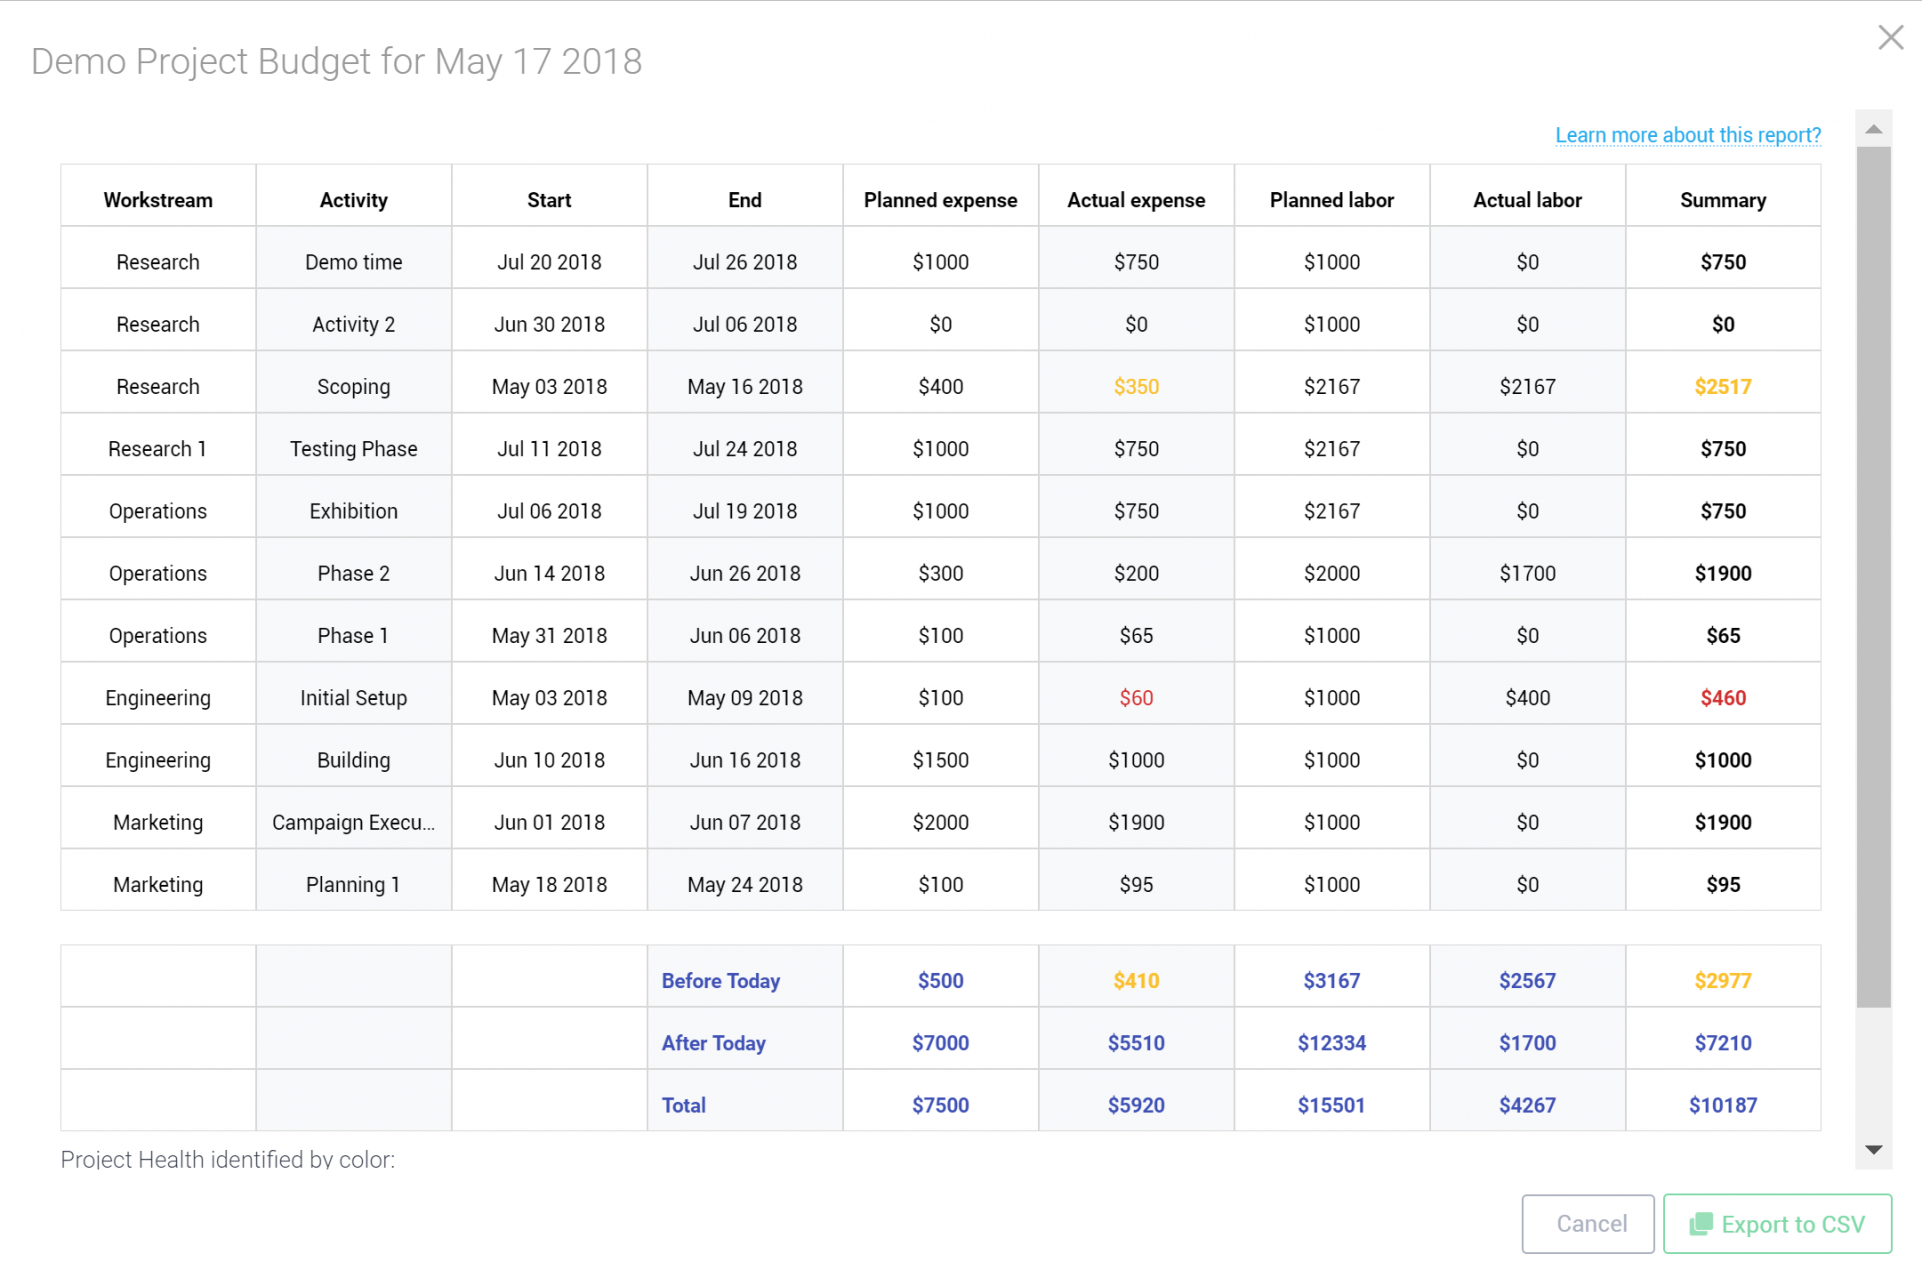
Explanation of Budget Report:
There are nine columns in each report;
- Workstream – The title of the Workstream
- Activity – The title of the individual Activity
- Start – Start date of Activity or Task
- End – End date of Activity or Task
- Planned Expense – Expected Expense for individual Activity or task
- Actual Expense – Actual expense for activity or task
- Planned Labor – Planned COST of Labor
- Actual Labor – Actual cost of Labor
- Summary – Overall summary of each Activity or task.
At the bottom of the report you will see a summary of the cost of the project up until today, the expected cost after today and an overall total
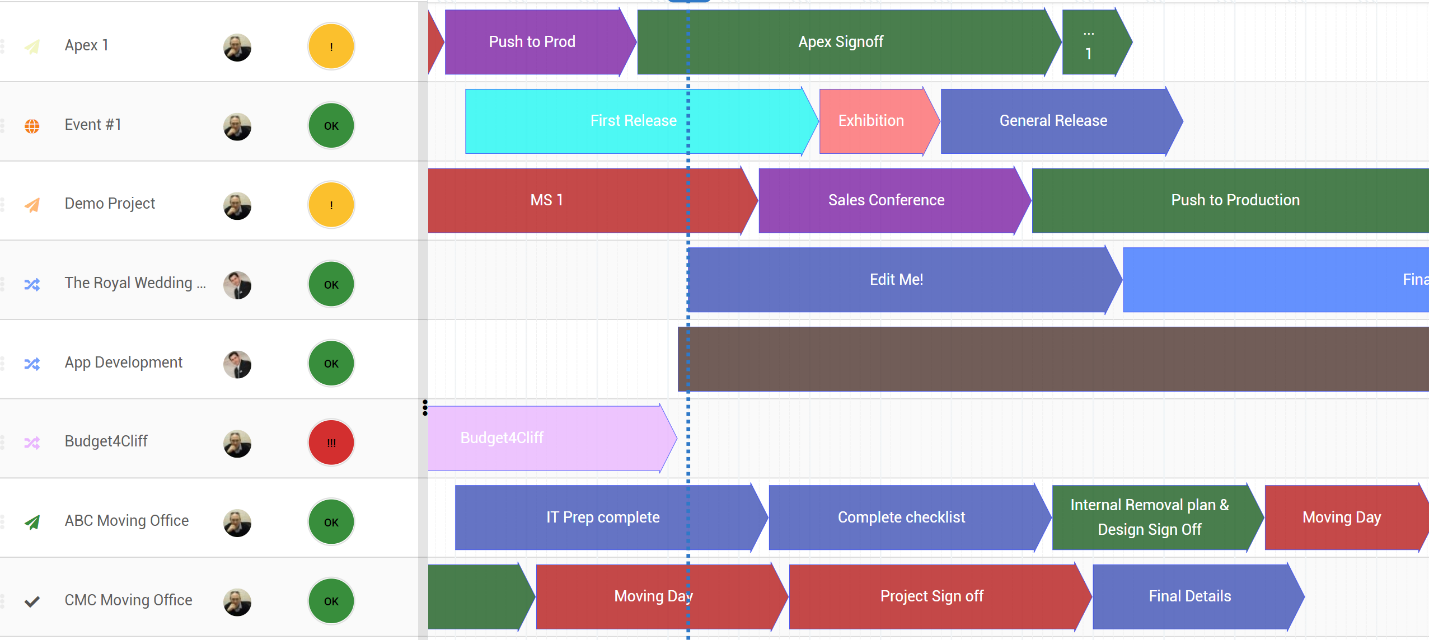
Project Health identified by colour
At a very quick glance you can see a “budget health score” for each of your projects in the Porject Portfolio page. By simply dragging the workstream bar to the right, you will see a colour which represents the overall health of the project.
Red = Over Budget
Green = On Budget
Yellow = Under Budget.
In summary, setting up budget reports is vital in project management as it enables financial control, supports informed decision-making, and helps ensure the project is completed within its budget.