Introduction
Proggio Dashboards are customizable, real-time visual reports that consolidate your project and portfolio data into one place.
They are designed to help you monitor key project metrics, spot bottlenecks early, and make informed decisions quickly.
They also serve as a reporting tool, allowing you to automate status reports and save time on manual updates.
Getting Started: Basic Setup Steps
Before you can build effective dashboards, you need to ensure your Proggio workspace has the necessary data.
- Plan with Key Data: Within each project, define its structure, including tasks with start/end dates, assigned owners, milestones, and other key information. The richer your project data, the more informative your dashboards will be.
- Keep Data Up-to-Date: Dashboards are only as useful as the data behind them. Encourage your team to regularly update task progress, mark tasks as complete, and log risks for example to ensure the dashboards reflect reality.
- Leverage Saved Views: You can create filtered sets of data, called “Saved Views,” which can be applied to dashboard widgets for more focused reports.
- This is not a required step to start, but it helps customize dashboards later on.
Dashboard Types & Examples
Proggio provides several dashboard types, each serving a different purpose. By default, every workspace includes three main dashboards:
- Portfolio Dashboard:
This gives a high-level overview of all projects in a portfolio. It’s designed for monitoring overall portfolio health and for strategic decisions. It can include widgets for portfolio-wide KPIs like the number of projects on-track or delayed, or a timeline showing all active projects.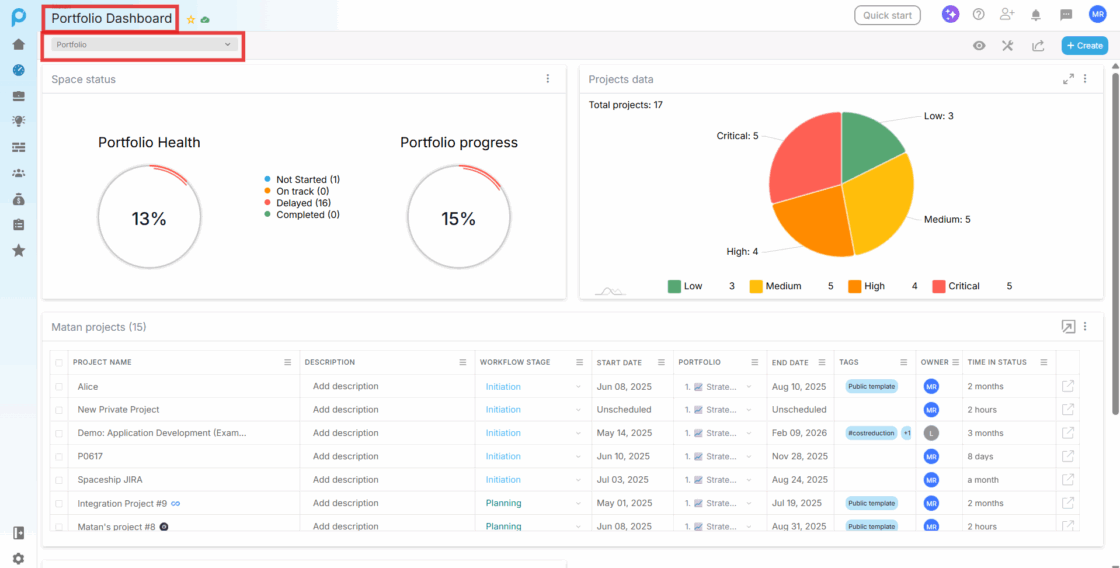
- Project Dashboard:
This provides an in-depth view of a single project’s execution. It’s ideal for project managers to drill down into a single project at a time. You can see the project’s timeline, tasks, issues, and status details on a single page. A key feature is the project selector dropdown at the top, which allows you to switch the dashboard’s focus to a different project instantly.
- Tasks Dashboard:
This focuses on the task layer across multiple projects, aggregating assignments for a cross-project view. It is especially useful for team leads or individuals to see all their tasks, upcoming deadlines, and overall workload in one place.
In addition to these default dashboards, you can also create your own customized dashboards. Simply add widgets relevant to your needs and configure them to slice the data any way you want — for example, by project owner, department, or status.
Creating Your Own Dashboard
Dashboards are a combination of widgets, and you can create your own to suit specific needs.
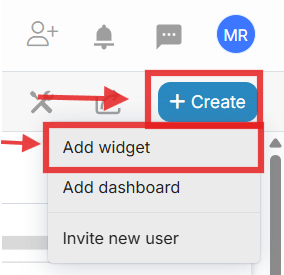
- Click the + icon on the top right of the screen.
- Select Add Dashboard.
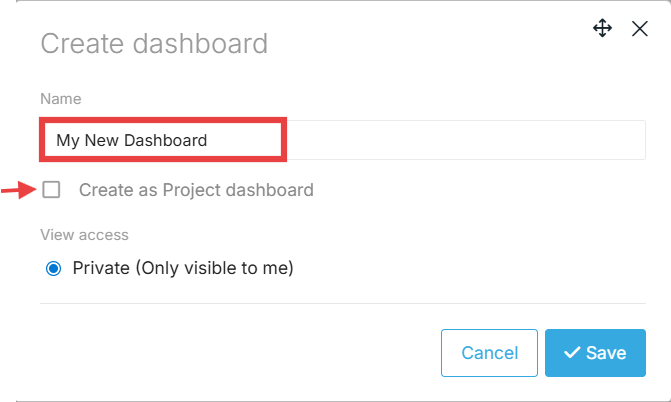
- Give your new dashboard a name. It will be private by default; only admins can create a public dashboard for the entire workspace.
- If you’d like your dashboard to function as a project dashboard, simply tick the checkbox next to this option.
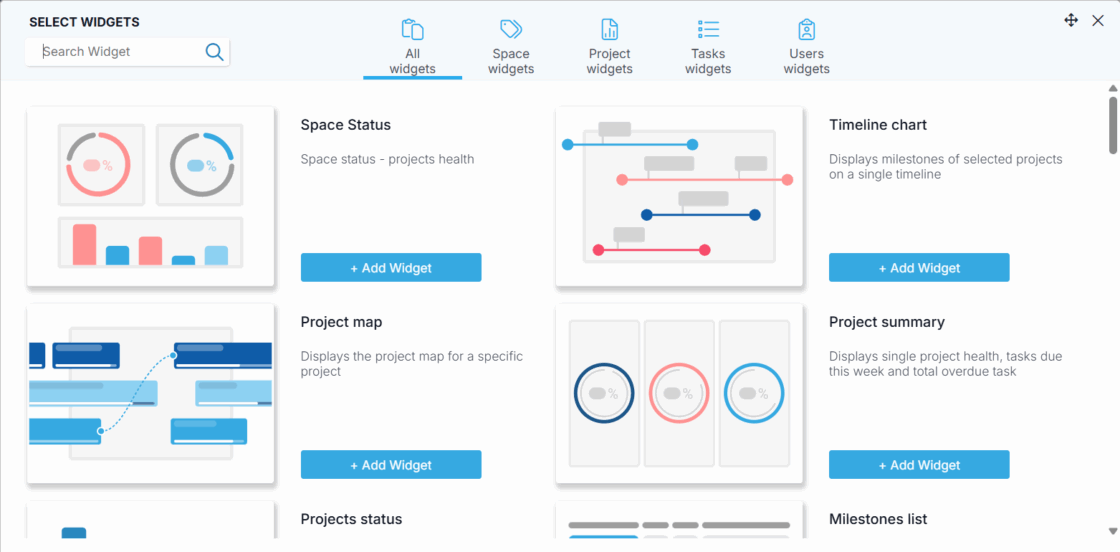
Once created, click the + Create icon again and select Add Widget to choose widgets from the library.
You can select widgets by category (Portfolio, Project, Task, or User) or choose a mixture from all categories.
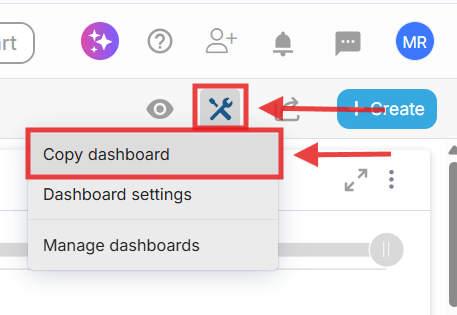
You can also copy an existing dashboard by clicking the Tools icon and selecting Copy Dashboard.
Configuring Your Widgets
After you add a widget to your dashboard, you can configure it to display the data most relevant to you.
- Click the three dots (⋮) in the top-right corner of the widget.
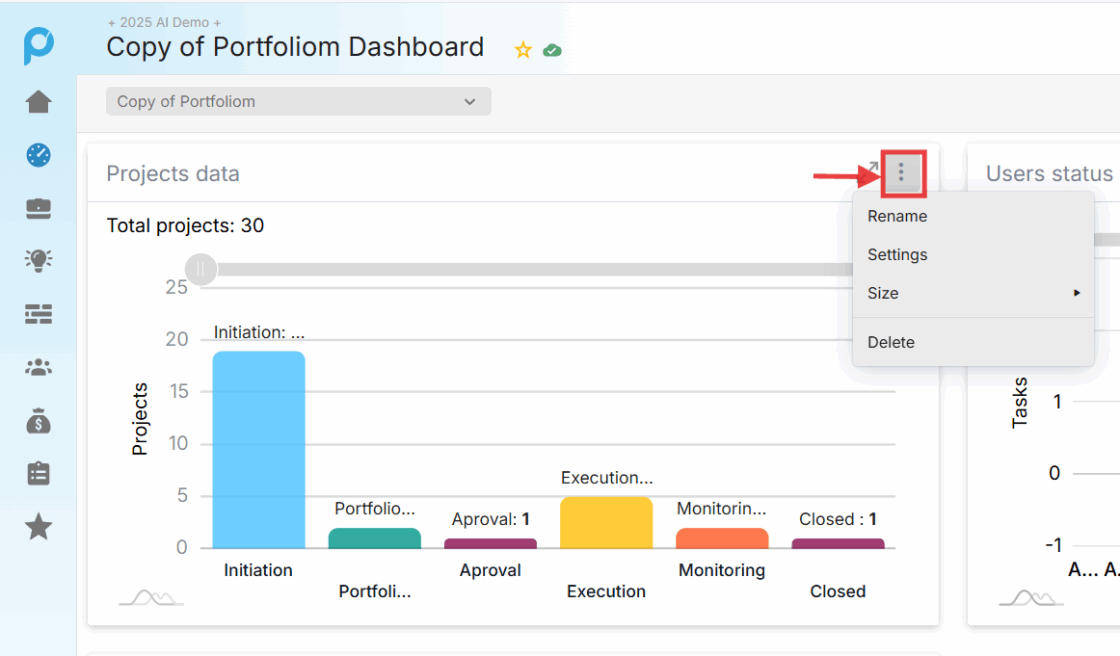
From here, you can:
- Rename the widget title (shown in the top-left).
- Resize the widget to fit your dashboard layout.
- Delete the widget.
- Open Settings to customize the widget’s data and display.
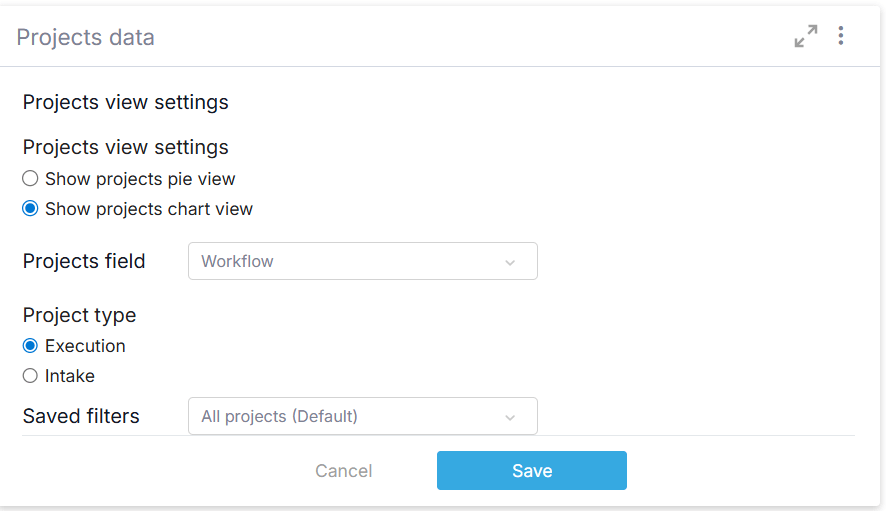
Each widget has its own settings options. For example, you may be able to:
- Slice data by Project Owner.
- Apply a filter or saved view so only certain projects/tasks are displayed.
- Switch between visual formats, such as pie chart vs. bar chart.
Once you save your changes, the widget will update to display exactly as configured, giving you tailored insights at a glance.
Sharing Dashboards
Dashboards can be shared with stakeholders to provide a clear, real-time view of project data.
- Click the Share icon.
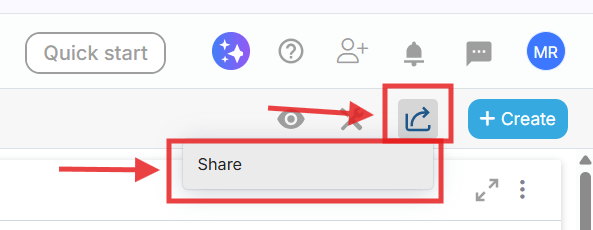
- Choose one of the following options:
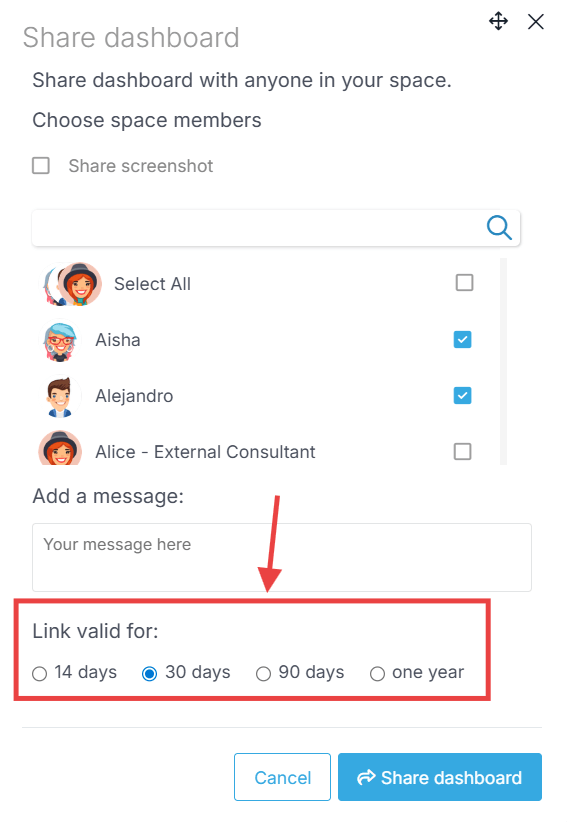
- Share a Link – The recipient will receive a link to a live view of the dashboard. They can see the most up-to-date data but will have no editing rights. You can also select specific users, add an optional message, and set an expiration date for the link.
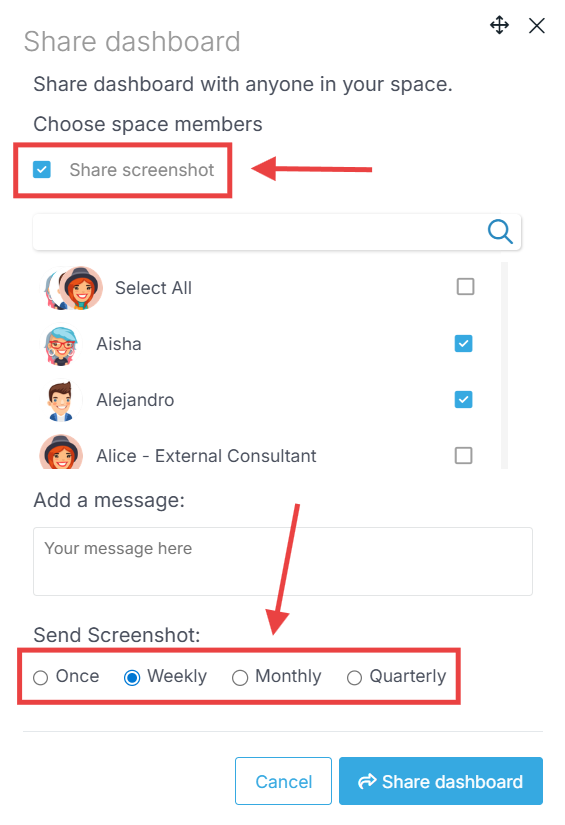
- Share a Screenshot – Send a snapshot of the entire dashboard via email. You can also schedule these emails to be sent automatically (e.g., weekly or monthly).
- Share a Link – The recipient will receive a link to a live view of the dashboard. They can see the most up-to-date data but will have no editing rights. You can also select specific users, add an optional message, and set an expiration date for the link.
Need Help?
For more help, feel free to contact us anytime at [email protected].